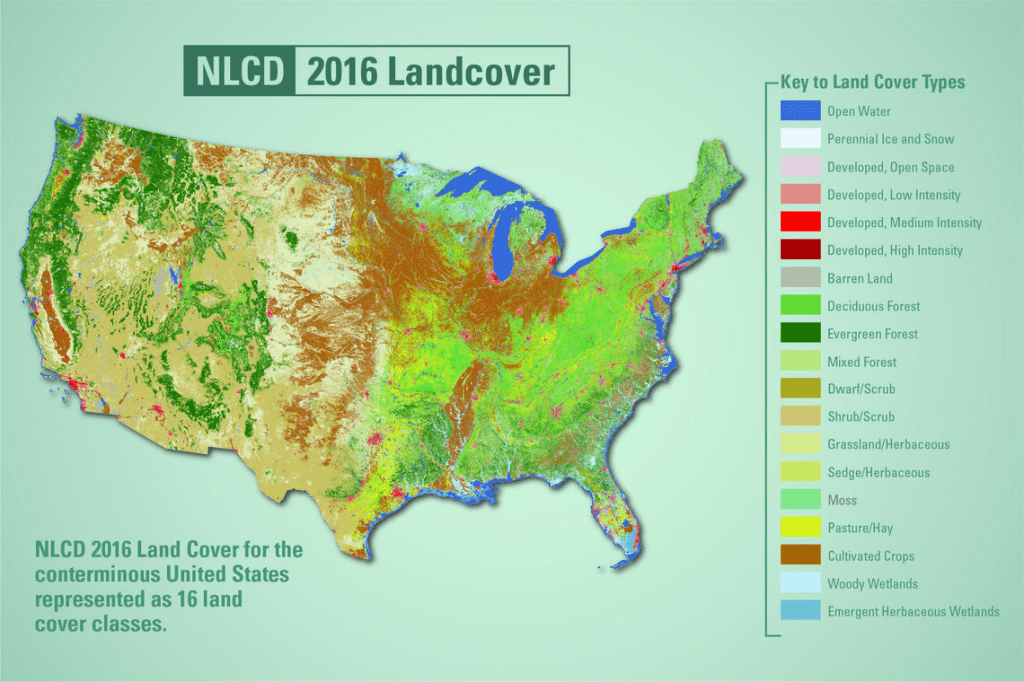
Understanding what covers the Earth’s surface—such as forests, cities, water, or farmland—is essential for many purposes. This process, called land cover classification, is an important tool for studying the environment, managing resources, and predicting changes like shifts in climate. It is valuable for tasks such as planning cities and forecasting weather. Accurate land cover information improves the quality of other studies, making it a highly useful resource. Advances in technology, particularly remote sensing and platforms like Google Earth Engine (GEE), have made creating these maps quicker, more precise, and available to more people. This article explains how remote sensing helps with land cover classification, the advantages of GEE, and the role of computer tools in this work.
What Is Remote Sensing?
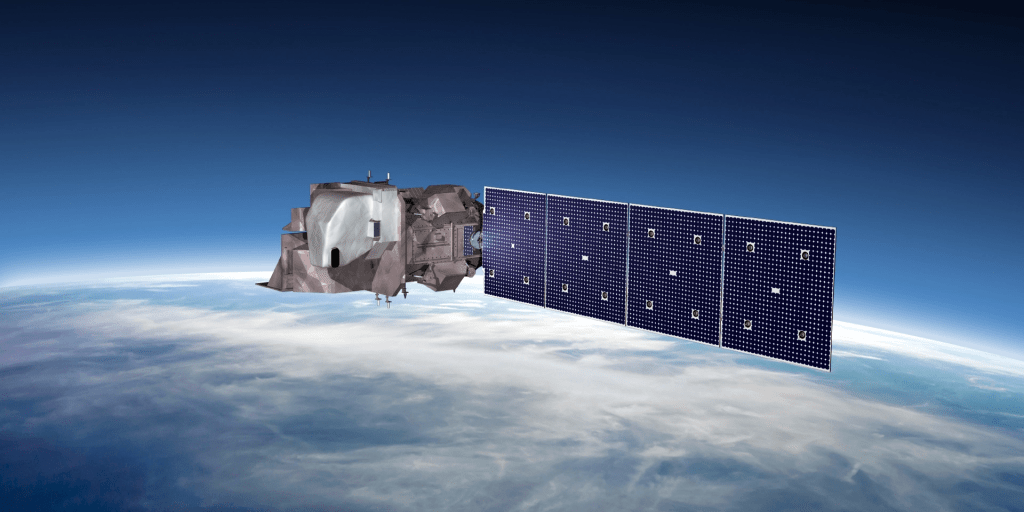
Remote sensing is a method of gathering information about the Earth’s surface from a distance, most often using satellites. These satellites capture images of the land, which help scientists identify what is present, such as trees or buildings. A key system for this is Landsat, which provides detailed pictures showing areas as small as 30 meters—about the size of a small park. Landsat satellites take new images every 16 days (or every 8 days with two satellites) and have been doing so for more than 30 years. This makes them excellent for observing changes over time, such as forests shrinking or cities growing.
Remote sensing allows us to examine large areas and track how land use changes. For example, it shows how human actions, like cutting trees or constructing roads, affect nature. These changes can influence animals, water systems, and weather patterns. However, mapping vast regions is challenging due to issues like clouds blocking the view and the large amount of data to process.
Difficulties in Mapping Large Areas
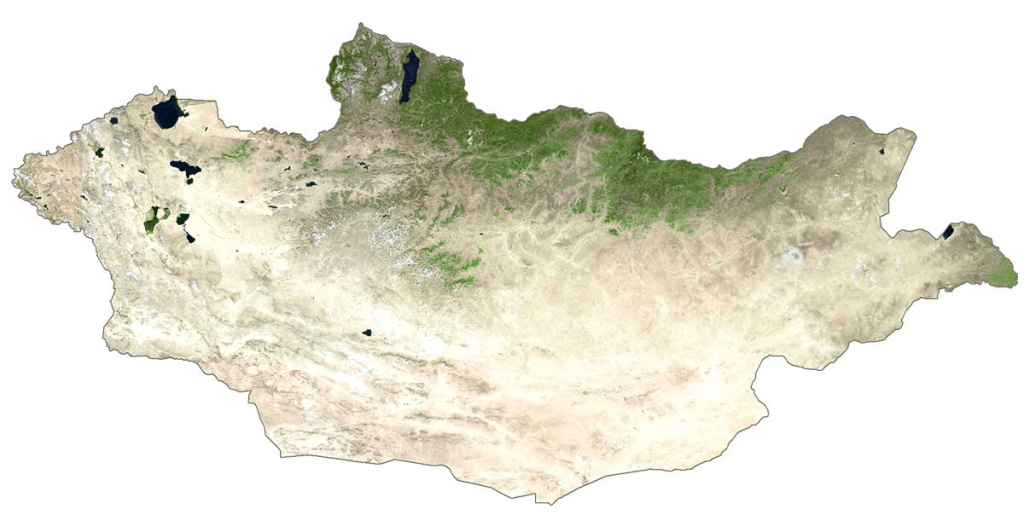
Mapping a whole country, such as Mongolia, requires many satellite images. For Mongolia, at least 125 Landsat images are needed. To make one clear map without clouds or snow, more than 800 images might be necessary. In the past, scientists had to collect, combine, and prepare these images, which took much time and needed strong computers. Clouds and snow often hide the land, making it difficult to get clear pictures.
These problems are sometimes called “big data” issues because there is so much information to manage. Ordinary computers struggle with this task, and extra steps—like removing clouds from images—add to the difficulty. Thankfully, new technology offers solutions to these problems.
Google Earth Engine: A Transformative Platform
Google Earth Engine (GEE) is a free online platform that simplifies working with satellite images. It allows users to access and study huge amounts of data without needing powerful personal computers. With GEE, people can select, clean, and analyze images directly on the internet. This makes it ideal for mapping large areas, such as countries or continents.
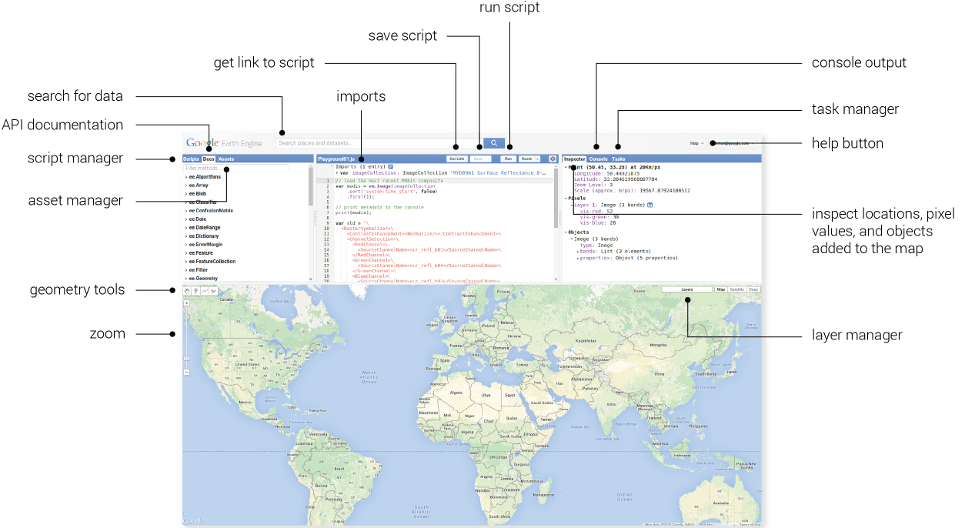
GEE is helpful in many areas, including farming, forestry, and city planning. It saves time since users do not need to download or store images themselves. For land cover mapping, GEE supports advanced computer programs that classify land quickly and accurately. Whether studying forest loss or city expansion, GEE makes it possible to work on a large scale.
The Merits of the Random Forest Classifier
To create maps from satellite images, scientists use computer programs called classifiers. One of the most effective is Random Forest (RF). RF works by combining many small decision-making programs, called “trees,” which analyze the data and decide what each part of the image shows—such as a forest, lake, or city. Each tree votes, and the final decision comes from the majority. This method is accurate and handles complex data well.

RF is widely used because:
- It often produces better results than other methods, like Support Vector Machines (SVM).
- It is simple to set up, requiring only two settings: the number of trees and the details each tree examines.
- It can show which parts of the data are most important, helping scientists understand the images better.
A study of 349 research papers found that RF is the most popular classifier for satellite images, showing it is both reliable and efficient.ncy.
Combining Images Over Time
When many satellite images are available from different times, they can be combined to make a clearer map. Two main methods are used:
- Temporal Aggregation: This method takes averages or middle values from multiple images to create one clear picture. For example, using the middle value of each spot over a year removes clouds and gives a better view of the land. This approach is fast and works well.
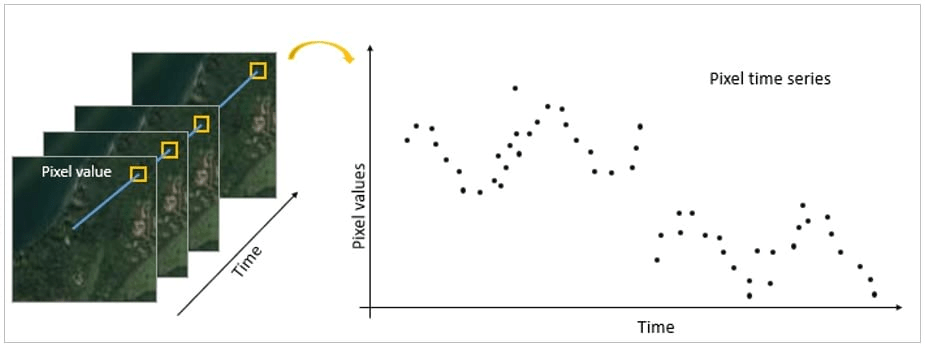
- Time Series Composition: This method uses all clear images from a specific time, sometimes over several years. It can show changes but may be less accurate if the images come from different seasons.
Both methods are valuable, but temporal aggregation is often preferred because it is simpler and quicker.
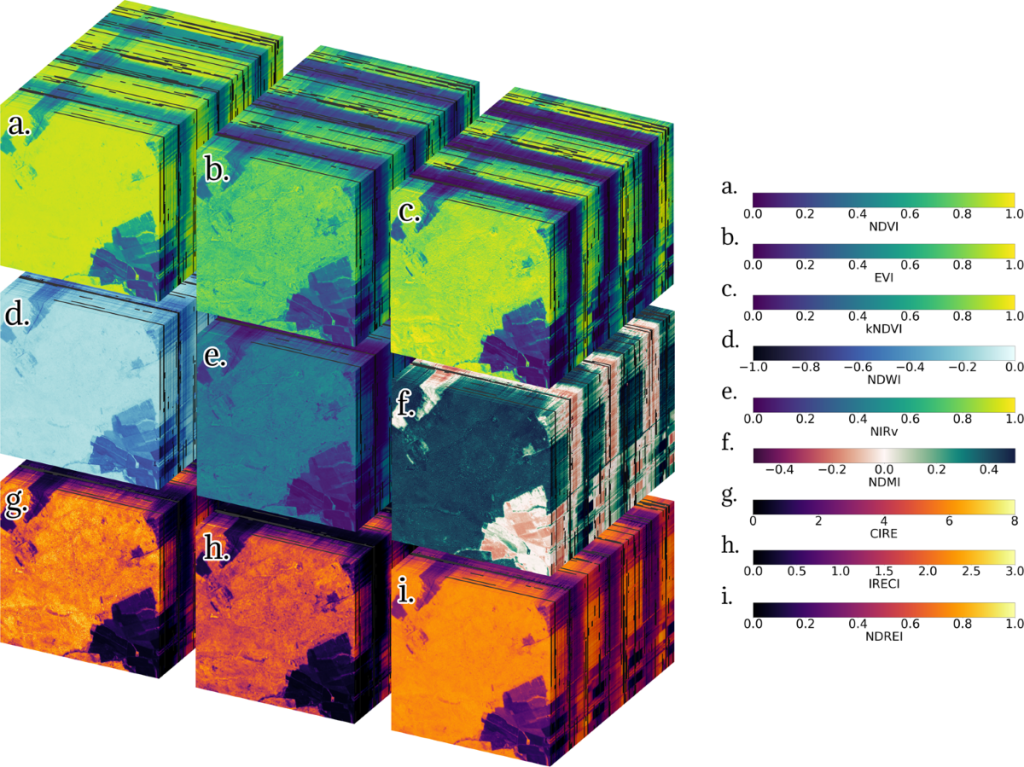
Enhancing Precision with Spectral Indices
Satellites record different colors of light, including some invisible to our eyes. By combining these colors, scientists create spectral indices, which highlight specific features on the ground. Examples include:
- Normalized Difference Vegetation Index (NDVI): This measures plant health using green and near-infrared light, helping to identify forests, crops, and grasslands.
- Normalized Difference Water Index (NDWI): This uses green and near-infrared light to locate water, like rivers or lakes, without confusion from plants.
- Normalized Difference Built-up Index (NDBI): This uses near-infrared and shortwave infrared light to find cities, where buildings reflect more light.
- Bare Soil Index (BSI): This identifies areas with little vegetation, such as empty fields or deserts.
These tools, combined with other satellite data, improve map accuracy. For instance, adding heat information can increase precision by 5-6%, aiding in finding water or wet soil.ation accuracy. For instance, incorporating the thermal infrared (TIRS) band may improve precision by 5-6%, aiding in the detection of water bodies and soil moisture.
Why These Maps Are Useful
Land cover maps have many practical uses:
Farming and City Planning: They guide decisions about where to plant crops or build homes, ensuring resources are used wisely.
Weather Forecasting: They help predict weather by showing how land affects the air above it. For example, forests cool the air, while cities warm it.
Environmental Protection: They track issues like deforestation or soil loss, especially in places like Ethiopia or Central Asia, where land is changing fast.
Conclusion
With tools like Google Earth Engine and classifiers like Random Forest, mapping the Earth’s surface has become faster and more accurate. These technologies allow anyone—from scientists to learners—to explore our planet using satellite images and powerful computers. Whether you care about nature or planning for the future, these tools are free and easy to use. Let’s try them and discover more about our world!
Thanks for reading! Now it is time to deepen your skills by enrolling in my Udemy course, “Land Cover Classification in Google Earth Engine” and start creating your own land cover maps with confidence!

Leave a comment